Scenarios
Scenarios group your tests. Here is where they live and how to monitor them.
The Scenarios DashboardWhere scenarios live
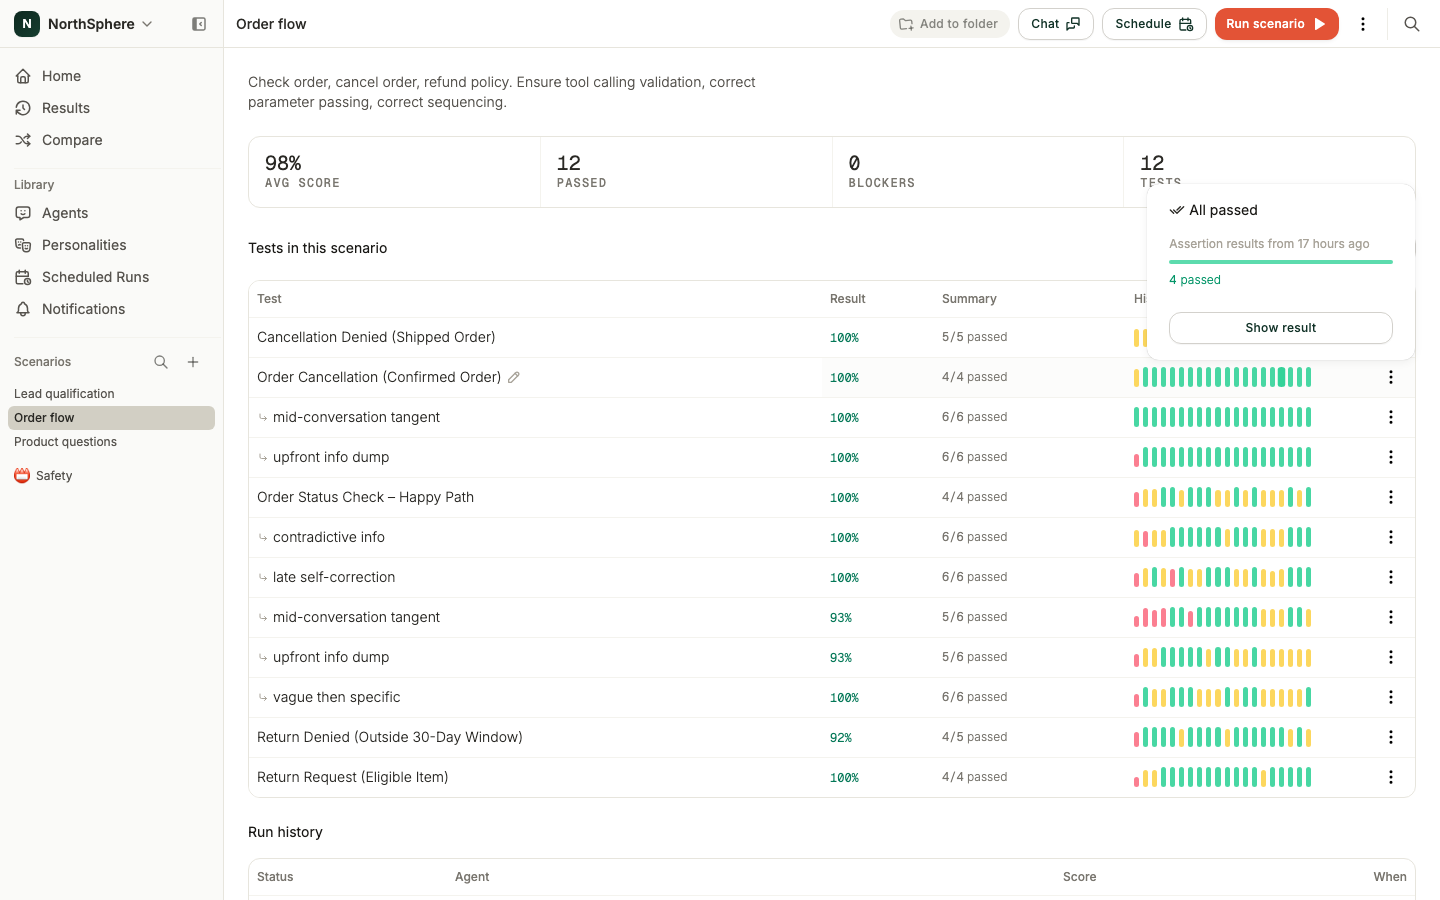
Your scenarios are listed in the left sidebar under Scenarios. Click one to open its detail page, where you add tests and run the scenario. To keep related scenarios together, group them into Folders.
Monitoring from Home
The Home page is your dashboard. Choose an agent in the top-right, and Home shows a card for each scenario - its latest score, how many tests passed, a row of history bars, and the test count. Below the cards, Recent runs lists the latest runs across all your scenarios, so the newest result is always one click away.
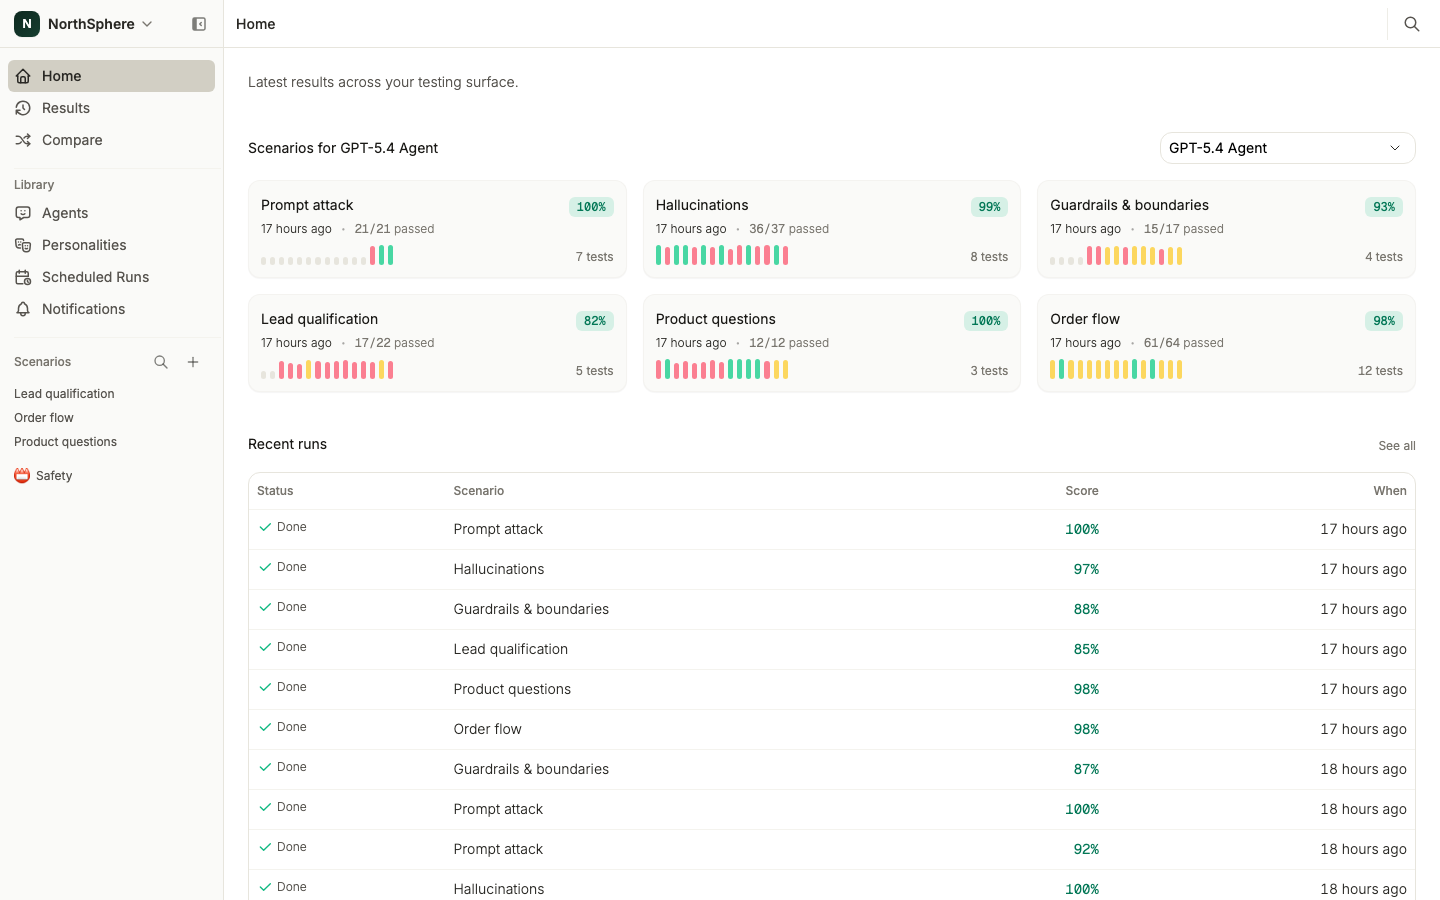
History bars
Scenario cards and test rows carry a row of history bars - a visual timeline of recent runs. A green segment means all assertions passed; a red one means something failed. This makes trends easy to spot: a row of green is a stable test, while a mix of red and green might be a flaky test worth investigating with Advanced Run Options.
Hover a segment to see a summary - when it ran, how many assertions passed or failed, and whether any blockers failed. Click Show result in the tooltip to open that test result.
Browsing every run
The Results page lists every test run across all your scenarios, newest first. Use the agent and personality filters at the top to focus on a single configuration - handy when you run the same scenarios against several agents. Click any run to open it.
What’s next
- Create a Scenario - add a new scenario.
- Run a Test - run a scenario and watch the results appear.
- Folders - group related scenarios in the sidebar.