Comparing Agents
Run one agent across the scenarios and personalities you care about and get a pass-rate verdict for each slice of your coverage. Use it to check that an agent is ready to ship, or as a coverage audit across different customer segments.
Comparing Agent PerformanceCreating a comparison
A comparison checks one agent against a structured slice of your coverage. You organize the work into groups, where each group picks a set of scenarios and one or more personalities to run them with. Every scenario in a group is run against every personality in the group. Groups let you tag different slices of the work (for example “New customers” vs “Existing customers”) and see a pass-rate verdict for each.
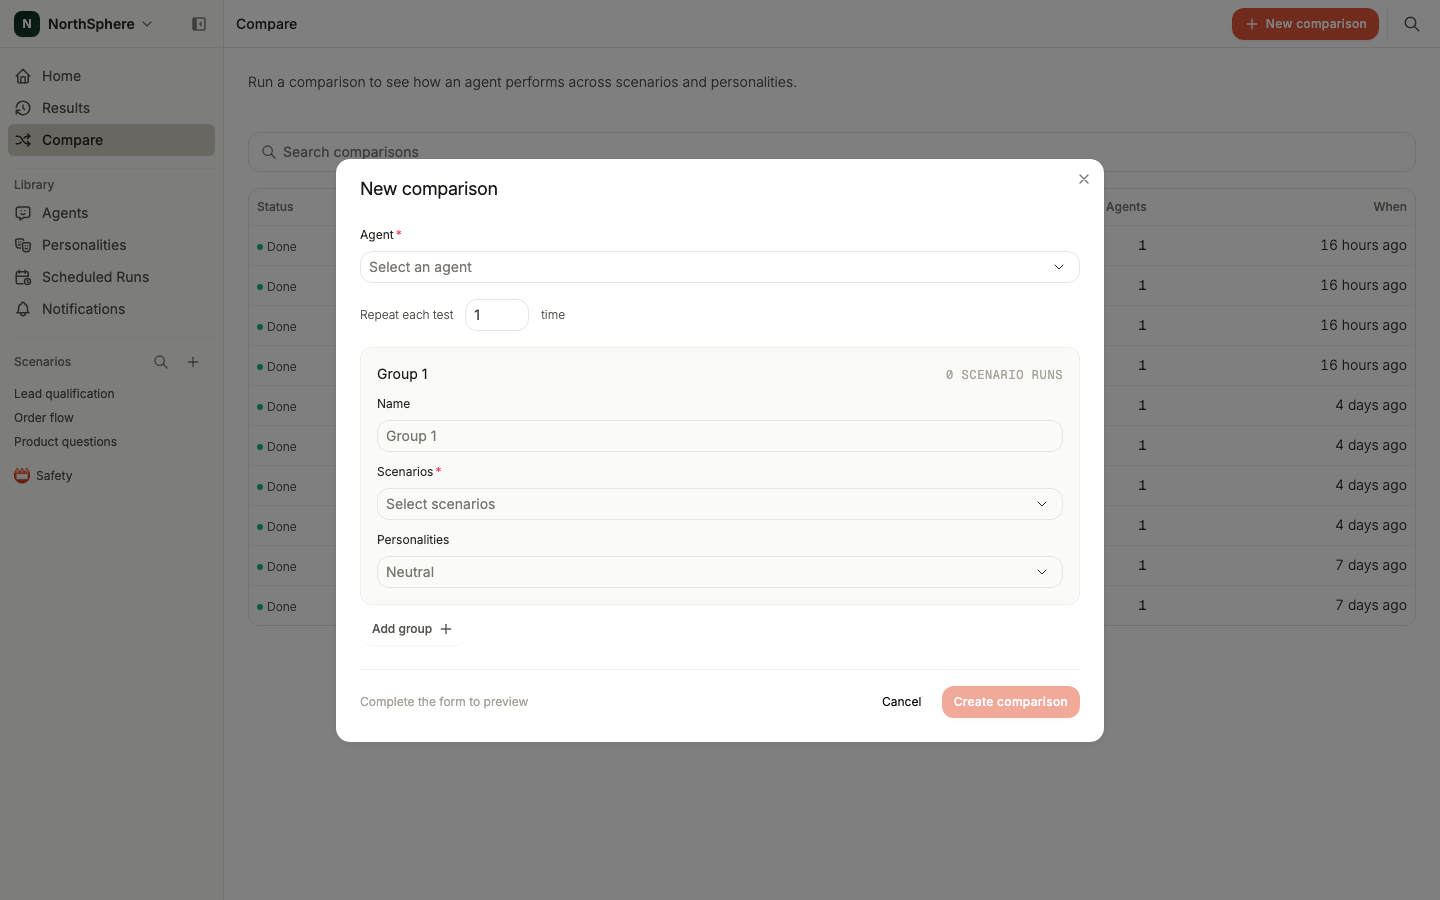
- Go to the Compare page in the left sidebar and click New comparison.
- Pick the agent being evaluated.
- Add one or more groups. For each group, give it an optional name and pick the scenarios and personalities it covers.
- Optionally set Repeat each test (1-10) to surface flaky behavior.
- Click Create comparison.
Voxli runs every scenario in each group against every configuration in that group and generates one test result per pair.
Reading the results
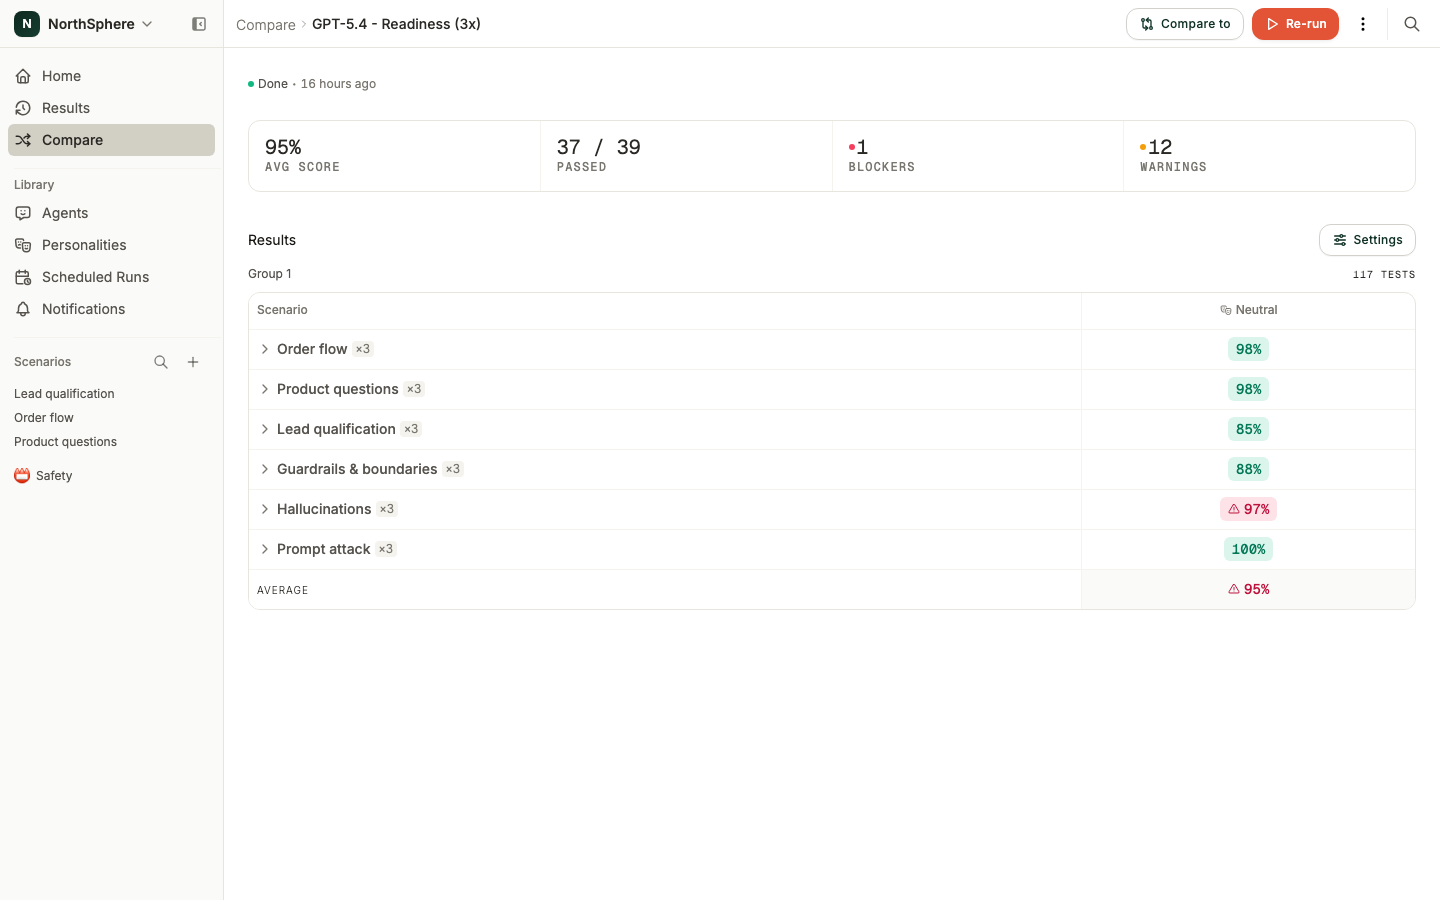
The results page opens with an insights row at the top showing the average score, how many tests have passed, and the number of blocker failures and warnings. Below that, each group is rendered as its own matrix of scenarios and personalities.
- Green pass rates (90% or above) indicate the group is ready to ship.
- Yellow (70-89%) indicates review-worthy issues.
- Red (below 70%, or any blocker failure) indicates a critical problem in that group.
Group names can be edited inline by clicking the title. Click a scenario row to expand it into its individual tests. Click any cell to open the full test result with the conversation transcript and assertion outcomes.
Choosing which metrics to show
Open the Settings (gear) menu above the matrix to control what each row reports. Under Metrics, pick one or more measurements - each one you select becomes its own column:
- Score - the weighted pass rate per test. Always available.
- Hallucinations - the number of unsupported or contradicted claims, when hallucination detection is on.
- Custom metrics - anything you have defined under Settings > Metrics, such as response time, token usage, or cost. Each metric and each of its aggregates (for example, an average and a p95) is offered separately.
The selector lists every metric you have configured, so you can read the comparison along one dimension at a time. To add more measurements, define them first - see Custom Metrics. The same Settings menu also switches whether personalities are laid out as columns or rows.
Your choices - the selected metrics, expanded scenarios, and layout - are stored in the page URL. That makes a configured view shareable, and it is restored when you come back to the report.
Repetitions and flaky cells
When a comparison repeats each test more than once, the matrix stays calm where the repetitions agree and only adds detail where they disagree.
A repeated cell shows the mean as its headline value. If its repetitions disagree on whether the test passed, the cell is flaky - click it to open a breakdown listing each repetition with its score, pass or blocker status, and a link to that result. A test counts as passed in the insights row only when every one of its repetitions passed.
To see every repetition as its own row, open the Settings menu and turn on Show repetitions. Each test then expands into one row per repetition, each linking to its result. This option becomes available once a test has run more than once.
Comparing two reports
Once you have more than one finished comparison, you can lay two of them side by side to answer “did readiness improve since last time?” or “how does agent X stack up against agent Y on the same scenarios?”.
- On a report, click Compare to (next to Re-run).
- Pick another completed report. The picker only lists reports with the same configuration - the same scenarios and personalities - since the agent is the thing being compared. Each option leads with the report name, with its agent and run time beneath. Search by agent or report name to narrow the list.
The view becomes a side-by-side diff. The report you picked is the reference (A) and the current report is the subject (B). Each metric becomes a three-column group: the A value, the B value, and a colored B - A delta - green where B improved, red where it got worse, and neutral for a change within the metric’s margin. Personalities are shown as rows in this mode. Anything that exists in only one report is kept and badged New or Removed.
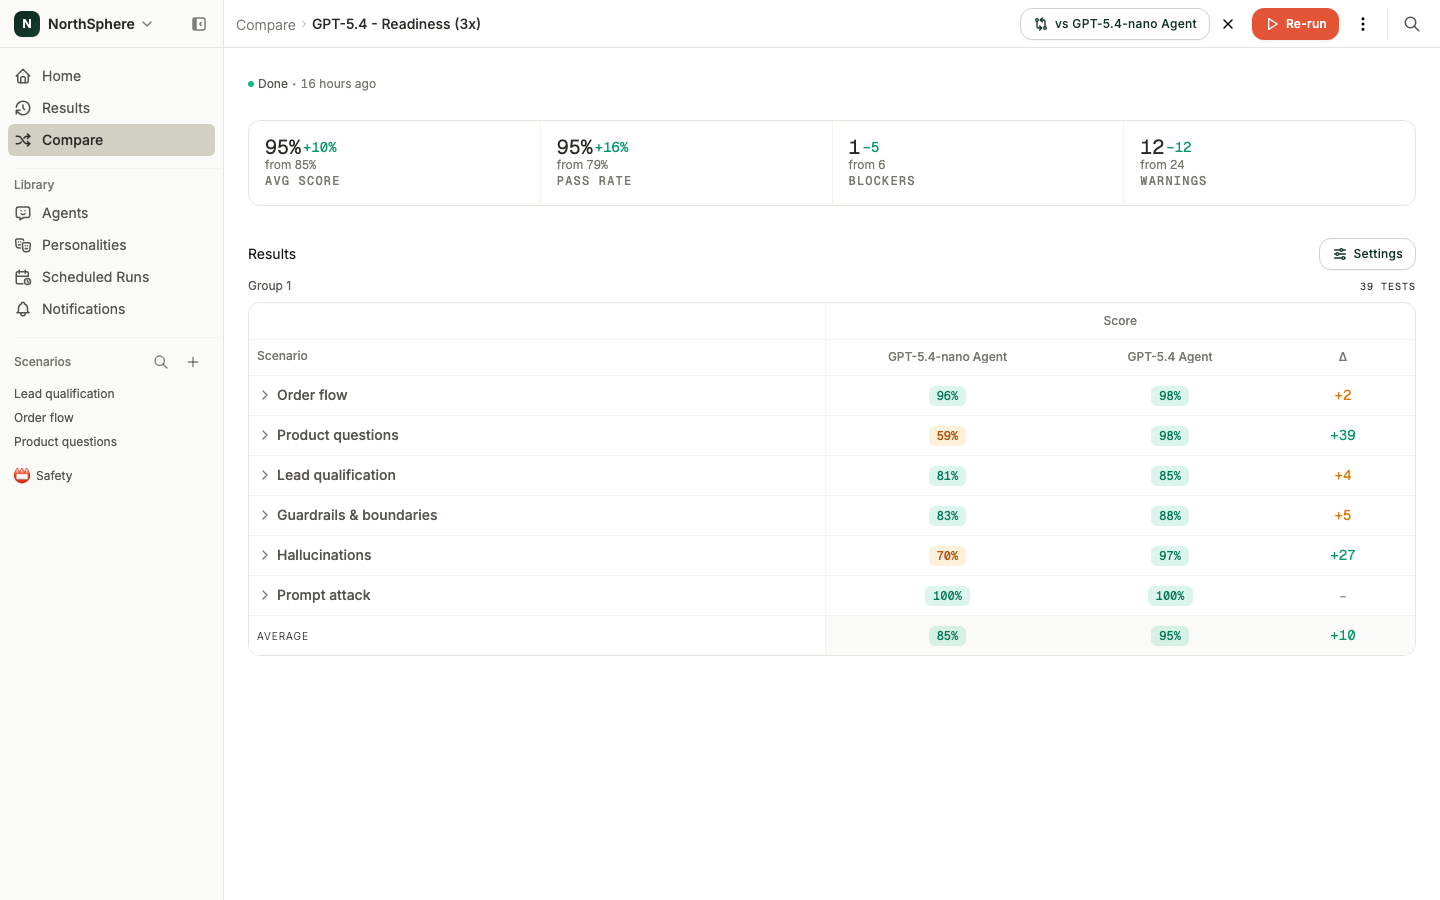
Clear the comparison with the ✕ next to the picker to return to the single-report view.
Re-running comparisons
After making changes to an agent (or the underlying scenarios) you can re-run an existing comparison to get fresh results. Re-run opens the New comparison dialog pre-filled with the same configuration, so you can adjust it if needed and track progress over time.
What’s next
- How Metrics Are Summarized - how the summary and average numbers are calculated.
- Custom Metrics - define the measurements the metric selector offers.
- Personalities - shape how the simulated user talks across groups or configurations.