Custom Metrics
Define your own measurements - like response time, token usage, or cost - and show them across runs and Compare.
What custom metrics are
Voxli always tracks two built-in measurements: the test score and the hallucination count. Custom metrics let you track anything else your agent reports, such as how long a response took, how many tokens it used, or what it cost.
Each custom metric is built from raw values your integration reports on each agent message. Voxli stores those raw values and combines them on demand into the summaries you see on a run, a test result, or a Compare report. You decide how the values are combined (an average, a maximum, a 95th percentile, and so on) and where they appear.
Defining a metric is a workspace setting. Reporting the raw values is part of your agent integration - see the Introduction in the developer docs for how an integration sends them.
Defining a metric
- Go to Settings > Metrics.
- Click Create metric.
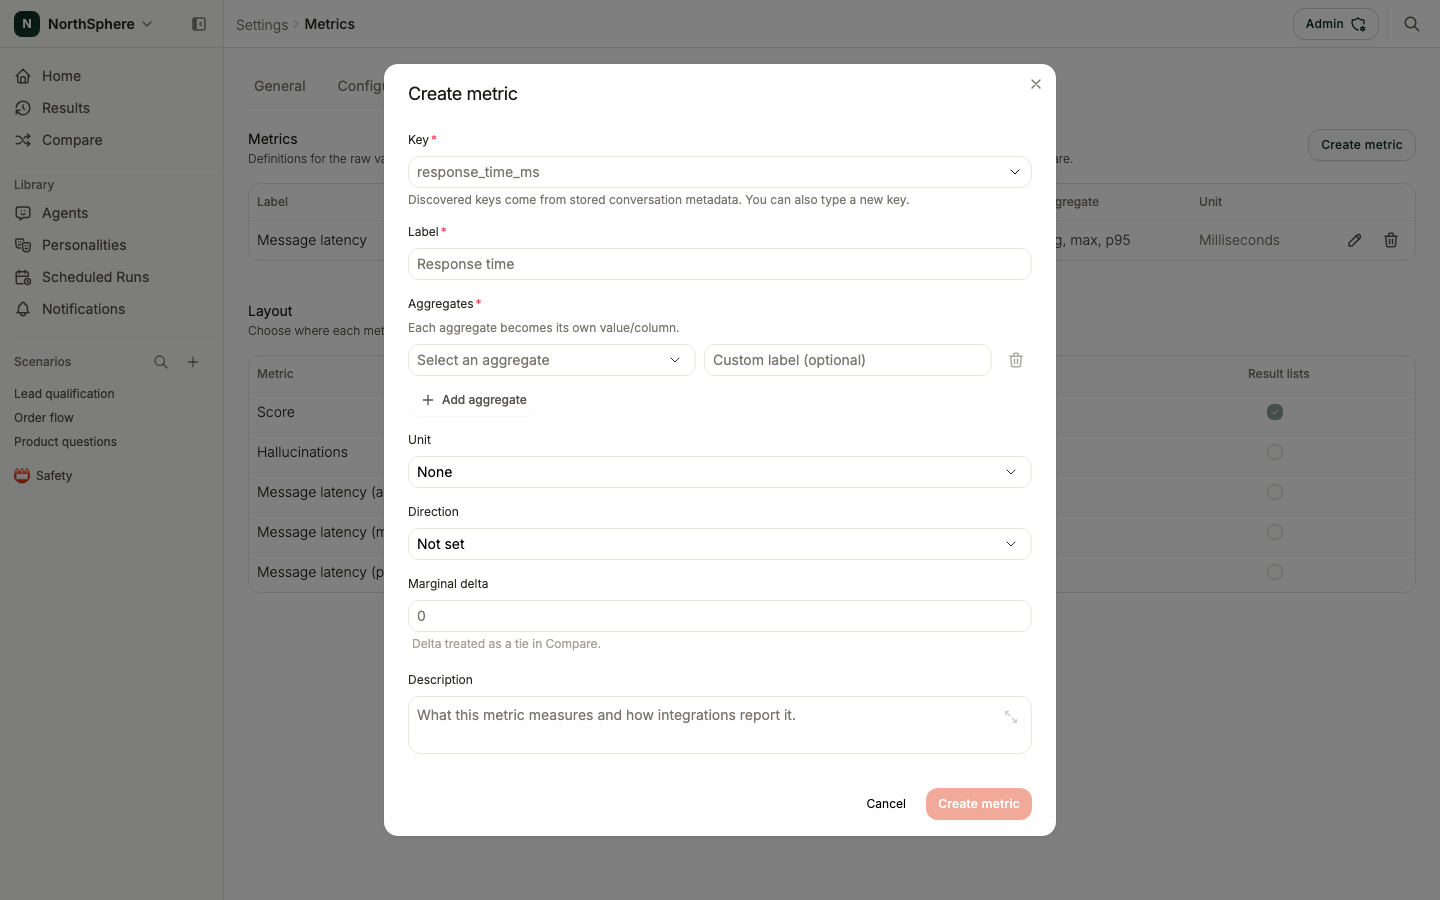
- Fill in the dialog:
- Key - the field name your integration reports (for example,
response_time_ms). Keys can use letters, numbers, periods, underscores, and hyphens. Voxli suggests keys it has already seen in your data, or you can type a new one. - Label - the display name users see (for example, “Response time”).
- Aggregates - how to combine the raw values. Pick one or more of sum, avg, min, max, count, Median (p50), p90, p95, and p99. Each aggregate becomes its own value and column - for example, an average response time and a p95 response time. Give an aggregate its own label if you want one (such as “Response time (p95)”).
- Unit - how to format the value: None, USD, Milliseconds, Tokens, Percent, Integer, or Decimal.
- Direction - whether Higher is better, Lower is better, or Not set. Compare uses this to color a change green or red.
- Marginal delta - an optional threshold. A change smaller than this is treated as a tie in Compare (colored neutral rather than better or worse).
- Description - an optional note on what the metric measures.
- Key - the field name your integration reports (for example,
- Click Create metric.
Each metric appears in the table with its label, key, aggregates, and unit. Use the row actions to edit or delete a metric. Deleting a metric stops it from being aggregated or shown, but the stored raw values are kept.
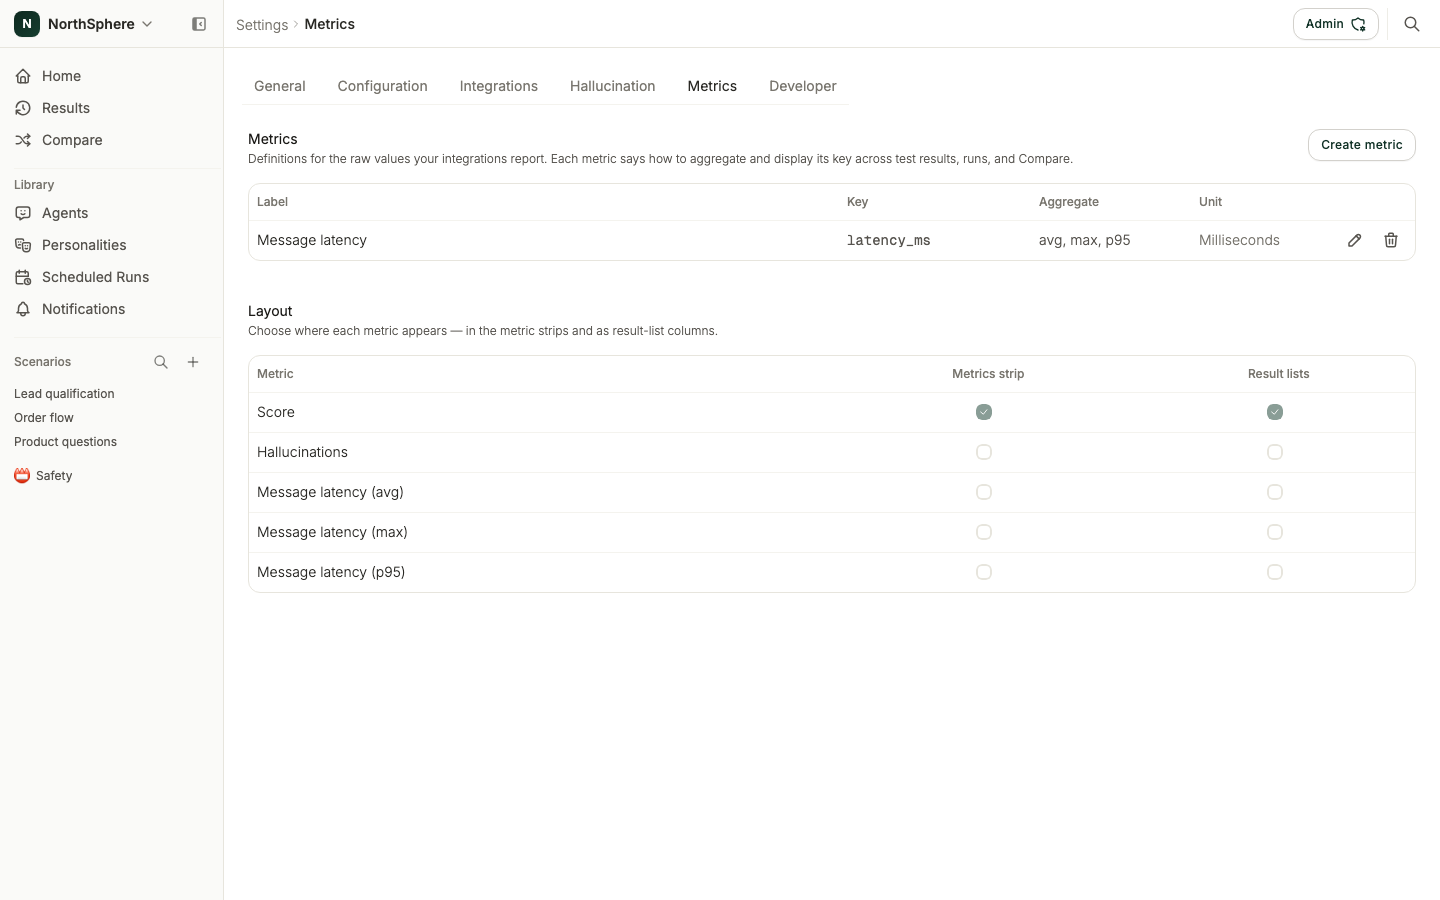
Choosing where metrics appear
The same page has a Layout section that controls where each metric shows up. Score is always shown. Every other metric is off by default and you turn it on per surface:
- Metrics strip - a compact row of headline numbers on run and test-result pages.
- Result lists - extra columns in a run’s test-result table.
Each aggregate is placed independently, so you can show a metric’s average in the strip while keeping its p95 only in result lists.
Custom metrics are also available in Compare. The metric selector there offers every metric you define here, so you can switch the matrix to read along response time, cost, or any other dimension. See Comparing Agents for how that works.
What’s next
- How Metrics Are Summarized - how Voxli folds raw values into a single number.
- Comparing Agents - switch the Compare matrix to a custom metric.
- Results - where the metrics strip appears on a test result.